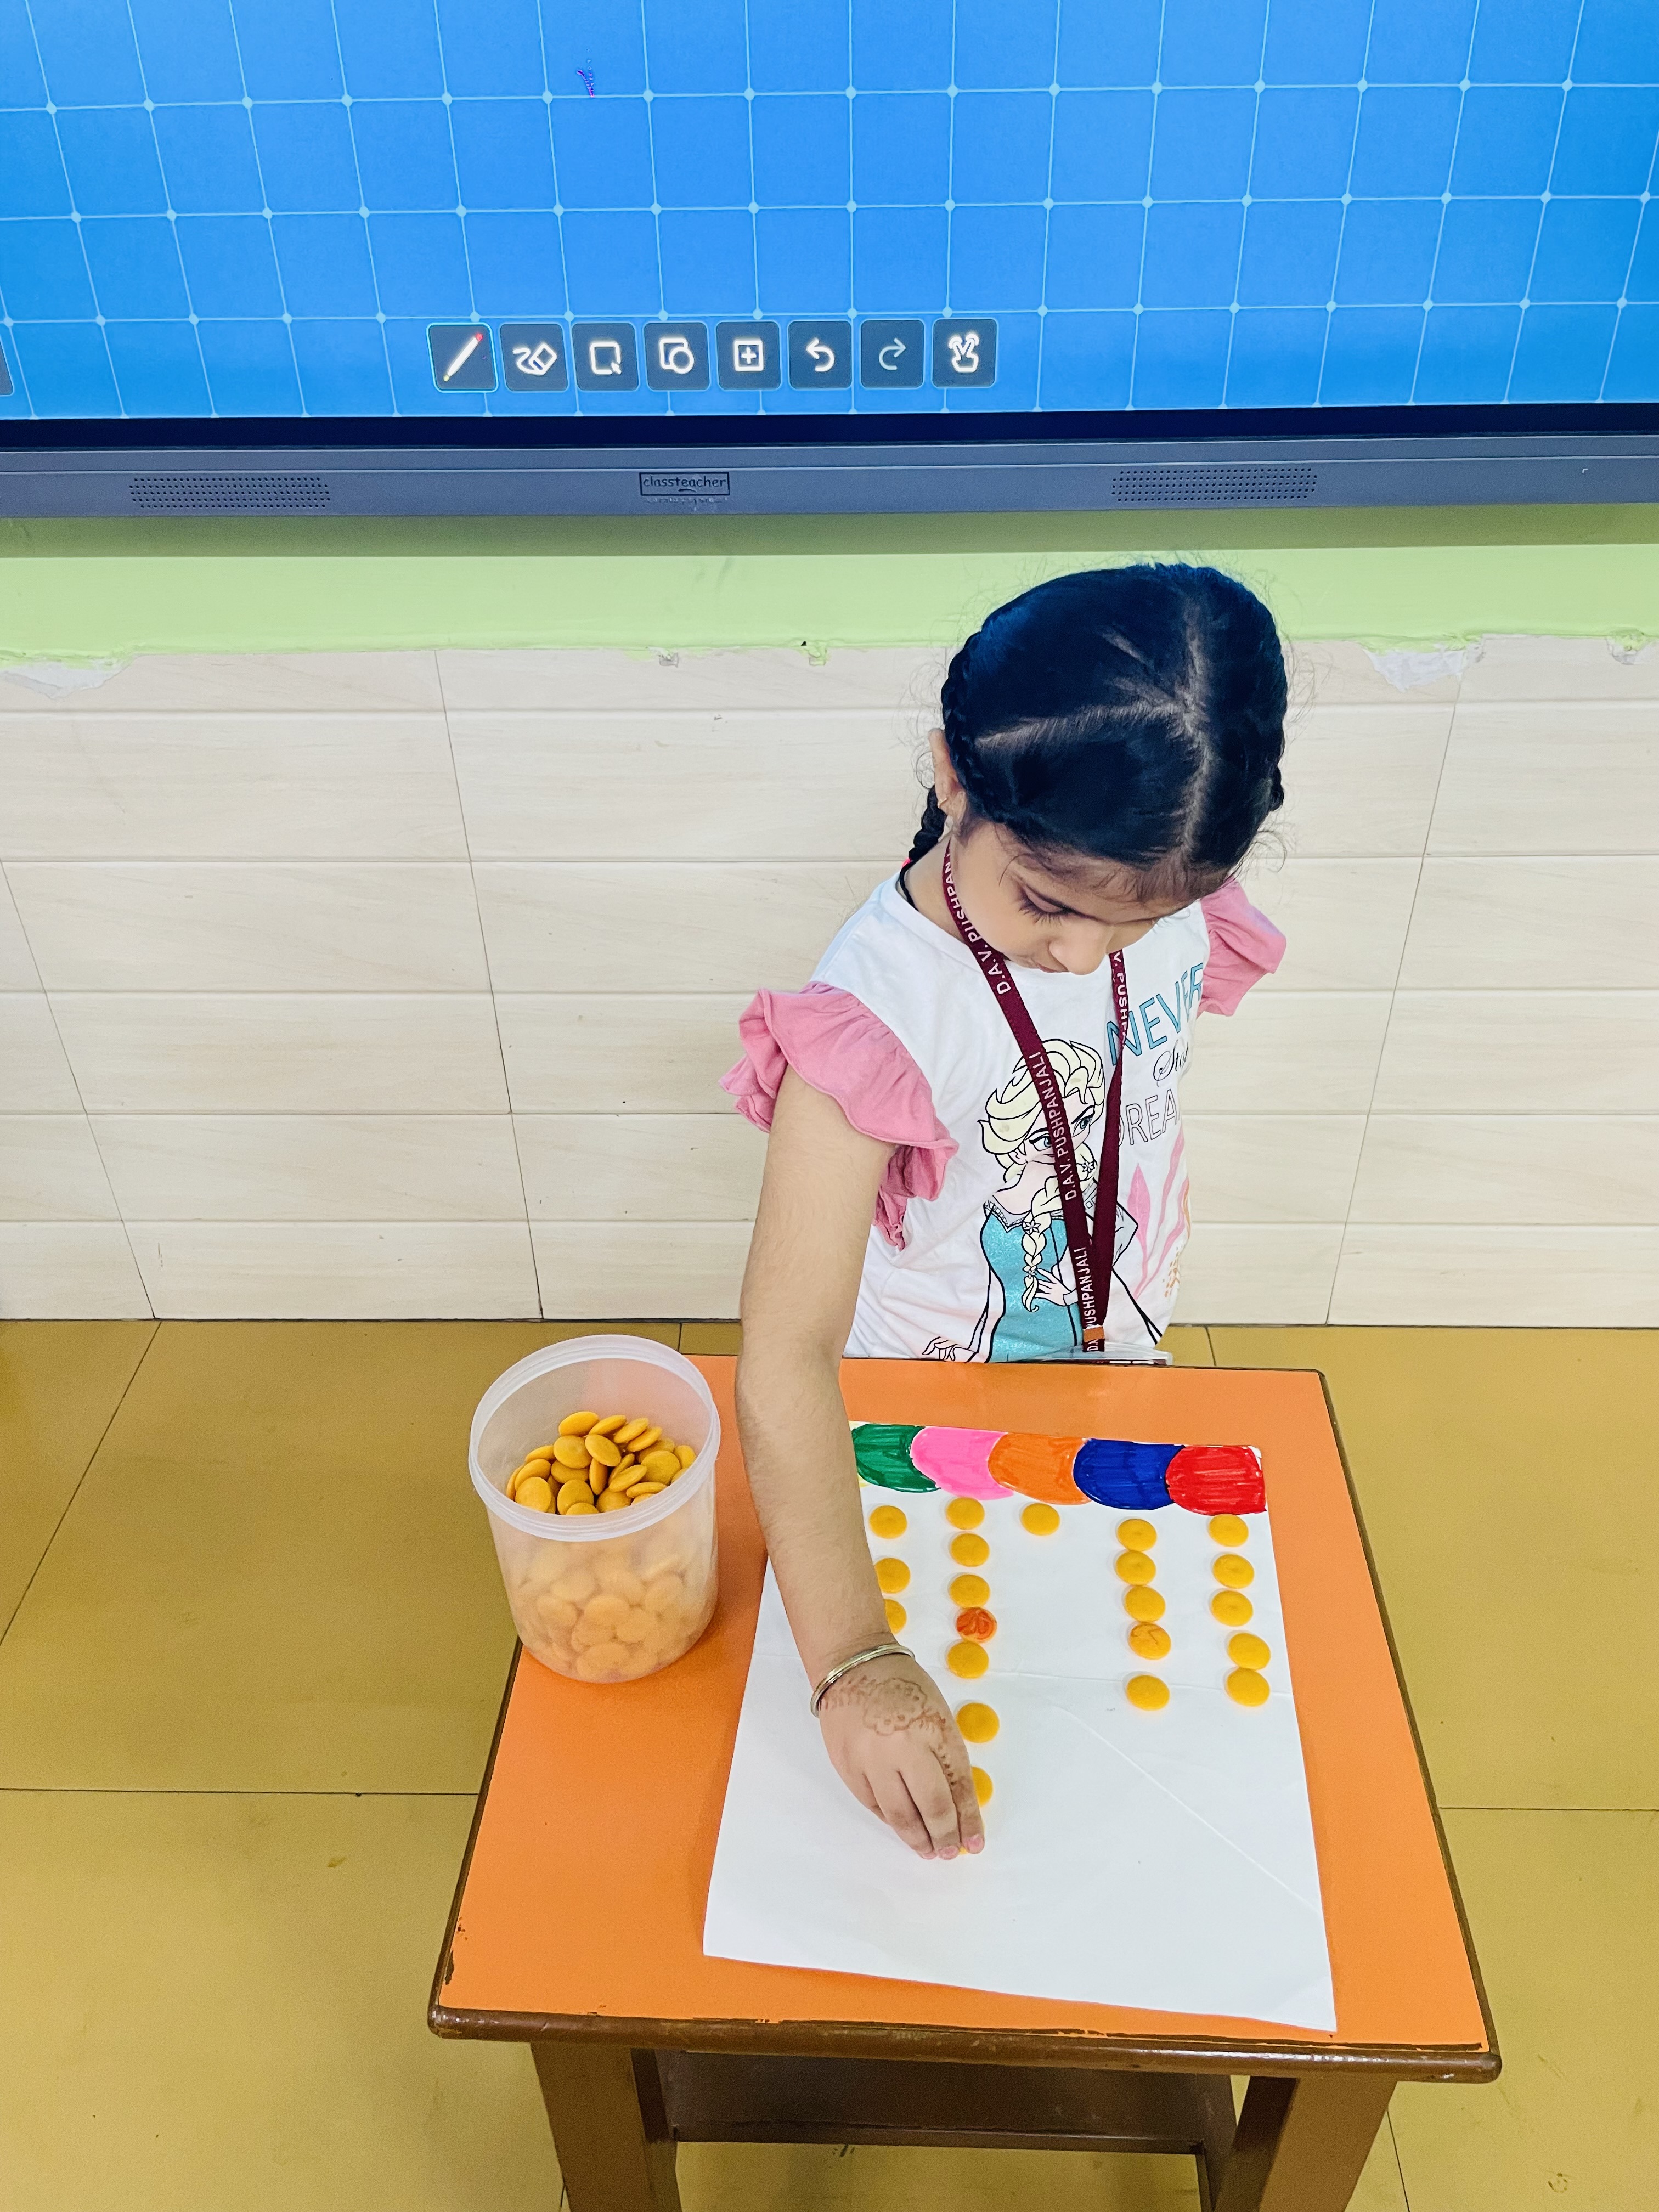
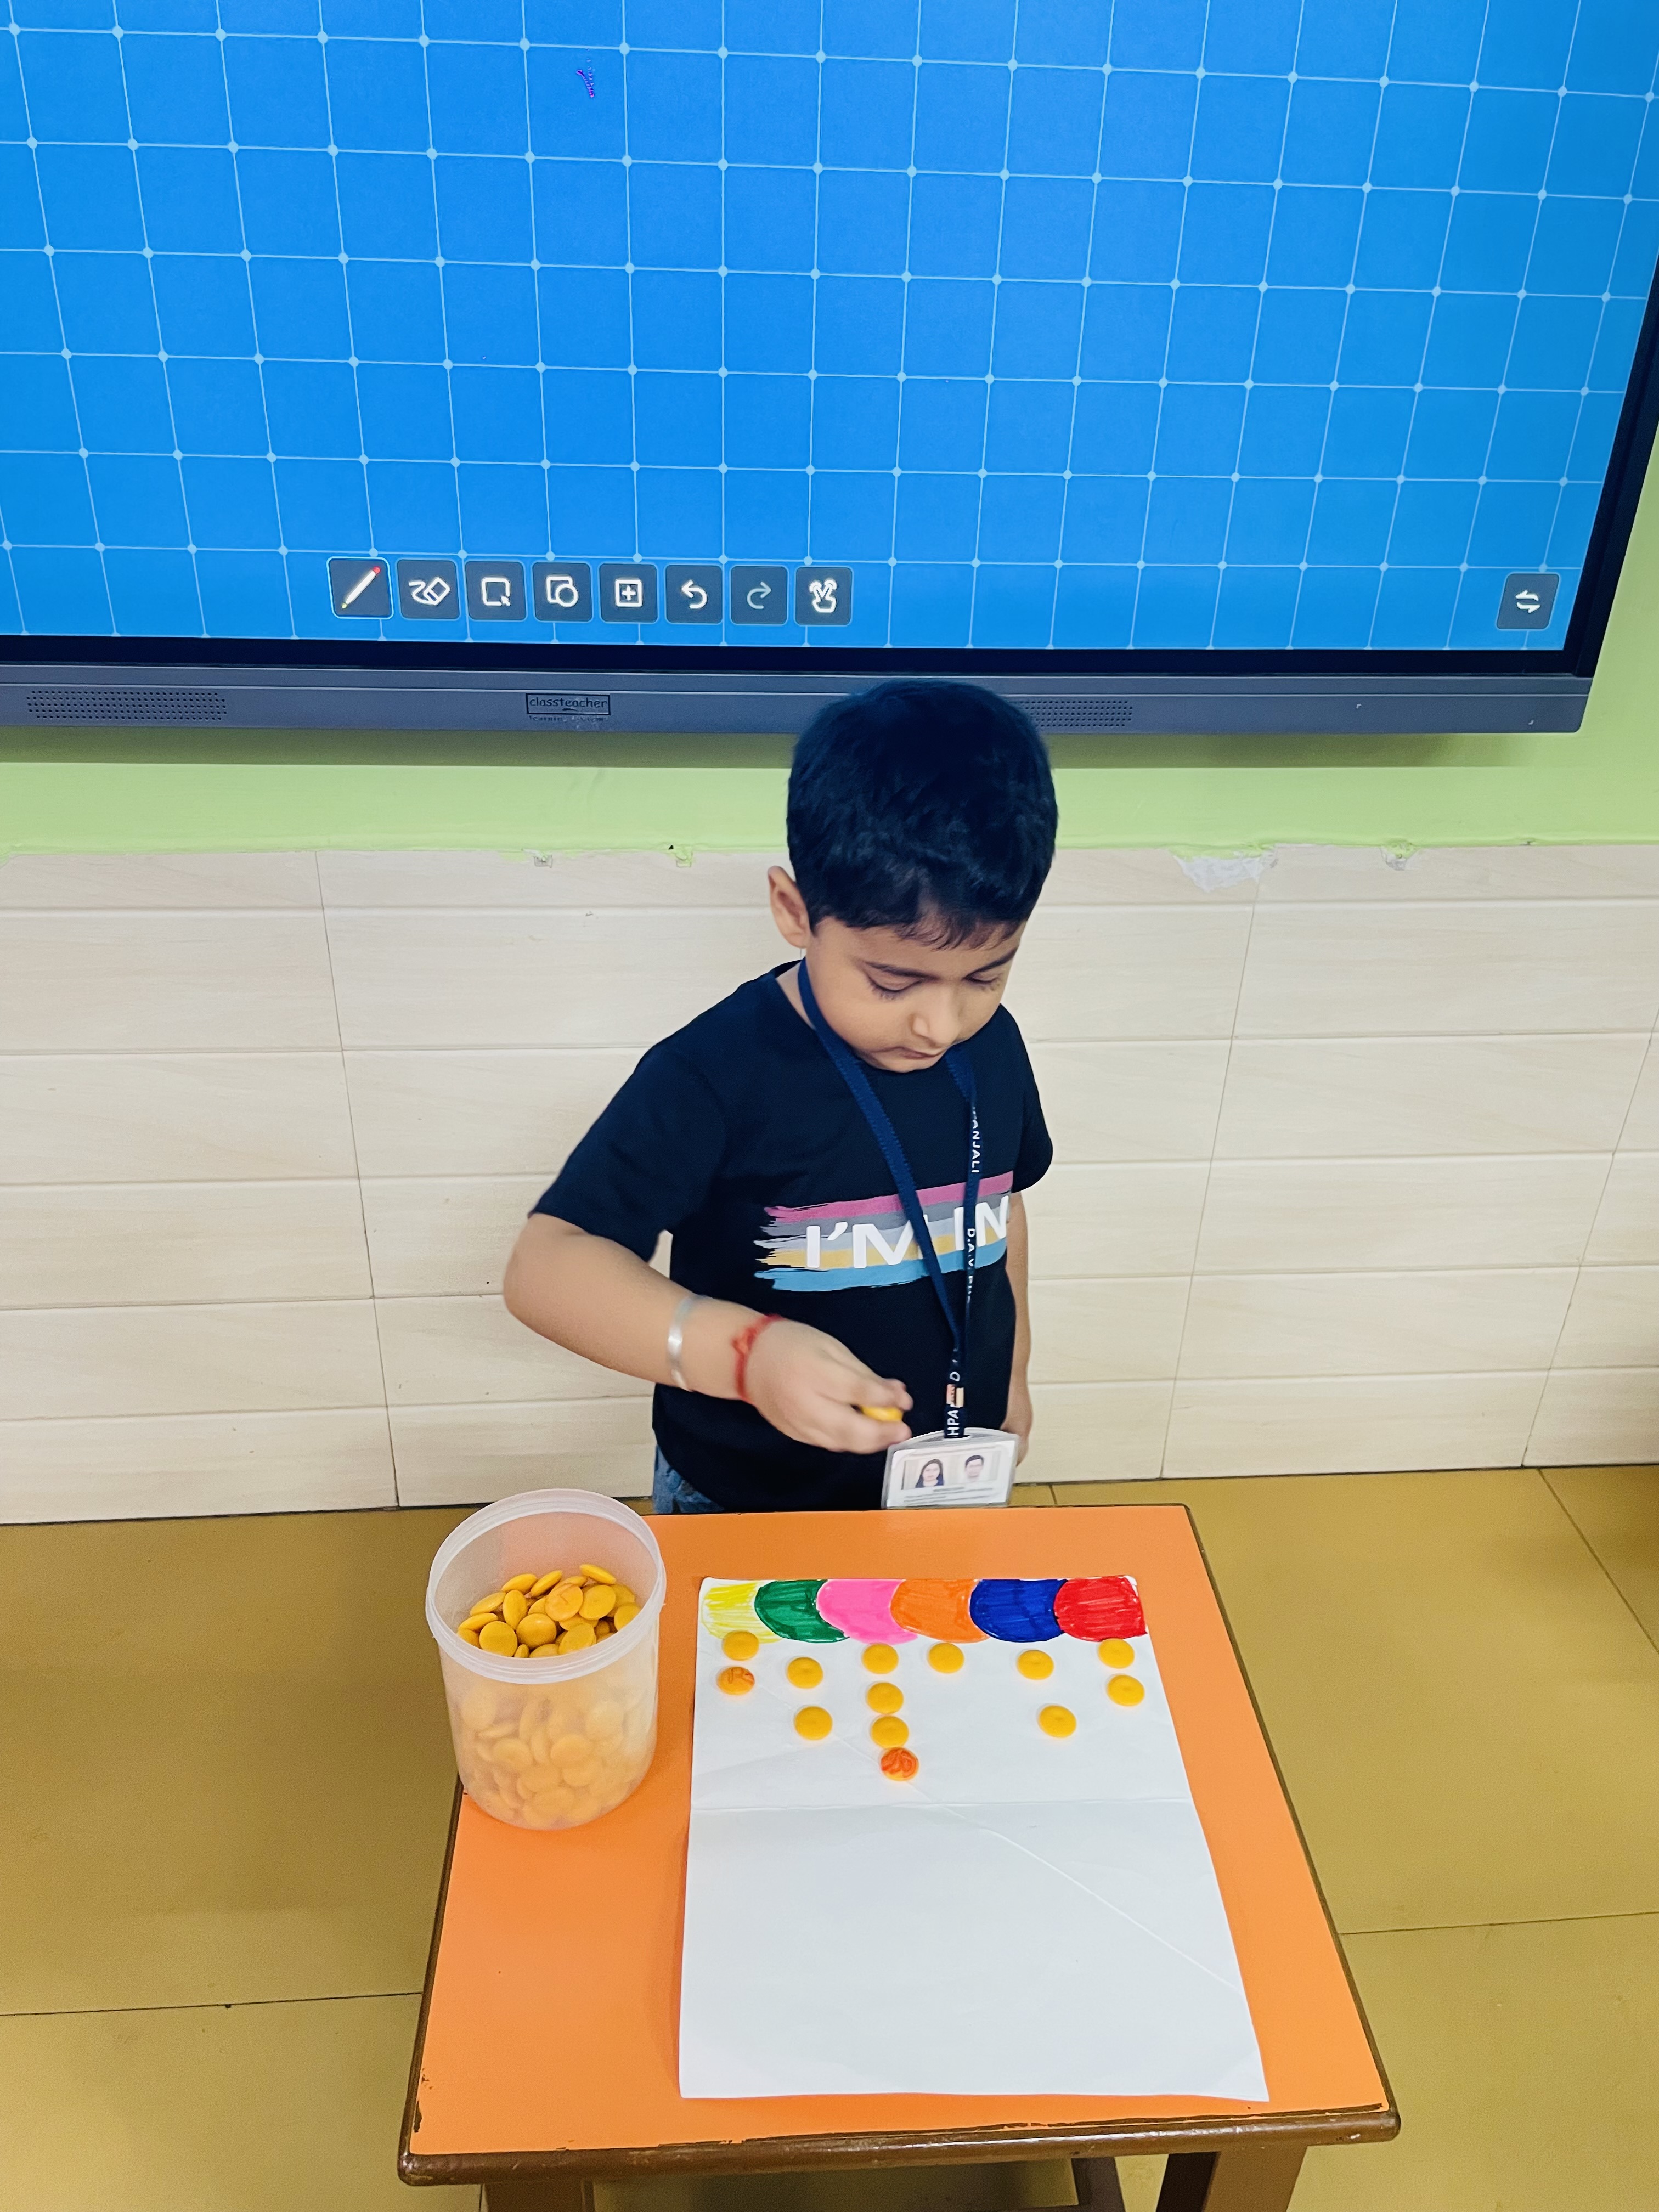
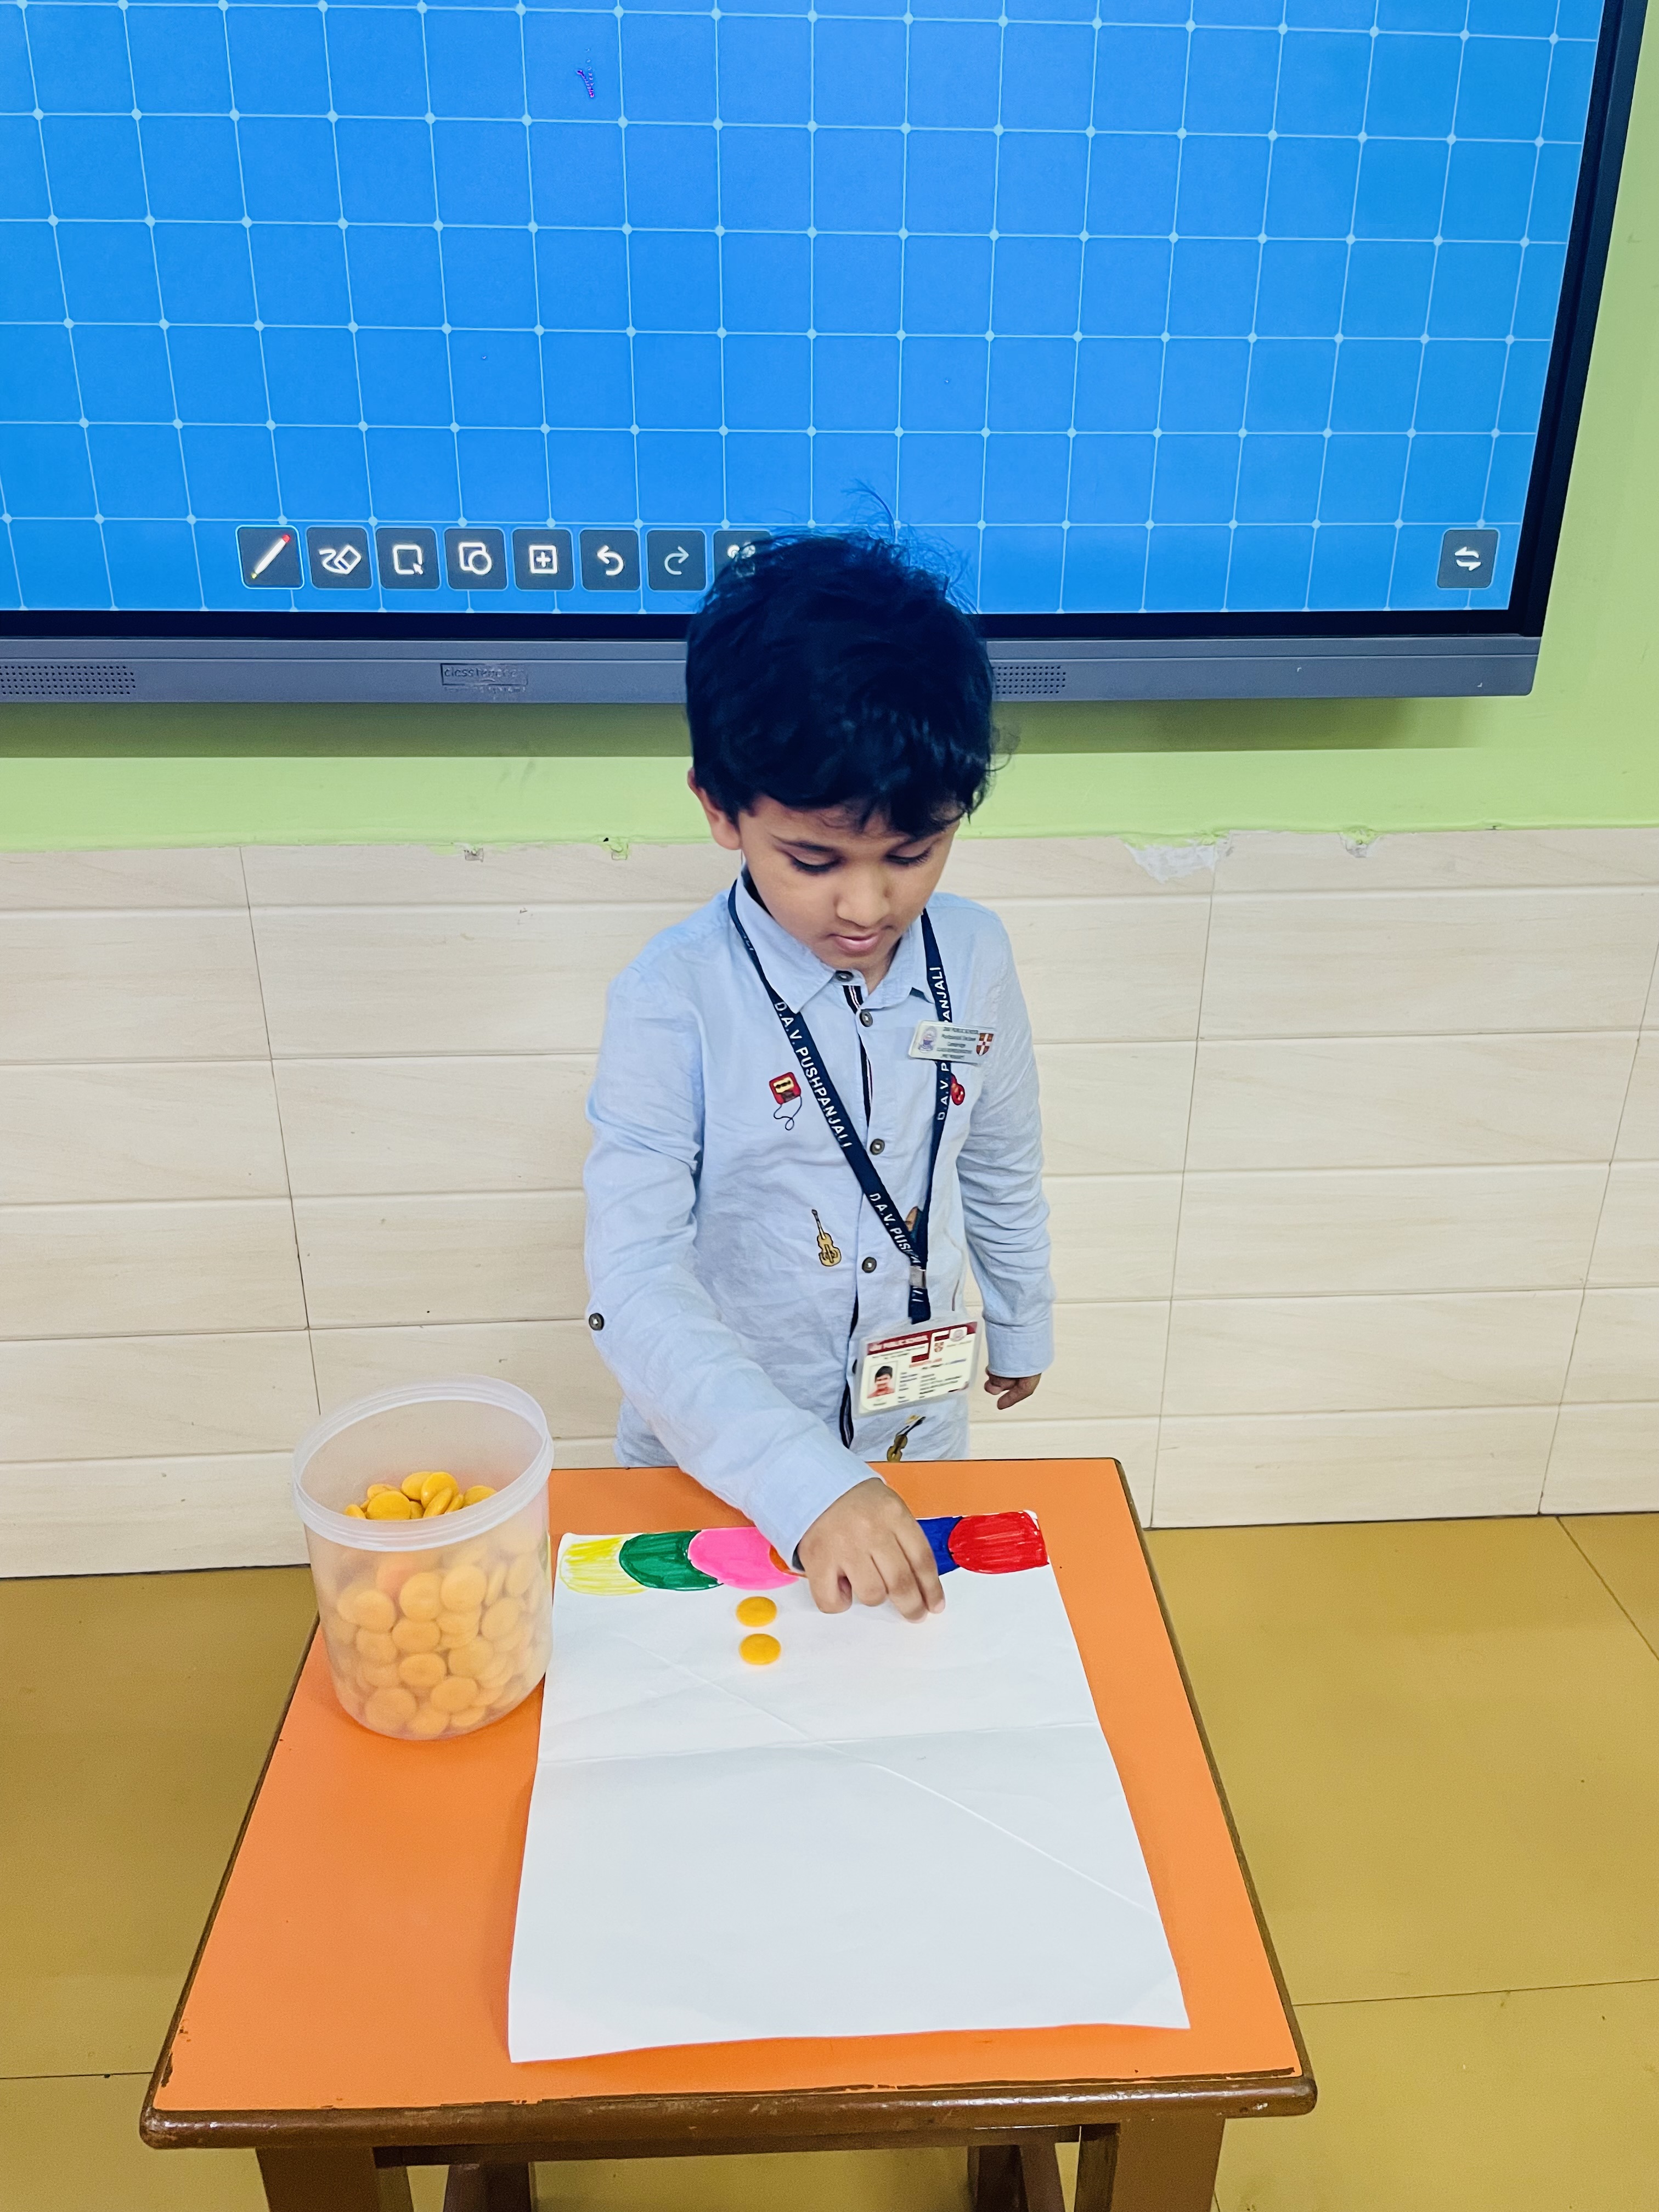
As a part of statistical methods , the concept of pictogram was given through an activity in which students placed counters above their favourite colour. Questions were asked related to the data collected like which is the most liked colour? Which colour is not liked by students at all.
Friday, August 23, 2024
Tuesday, August 6, 2024
Venn Diagram
Concept of Venn diagram was introduced through an activity. Two circles were made on the floor named boys and girls. Children distributed themselves among boys and girls and stood on the correct circle according to their gender.
Subscribe to:
Posts (Atom)
Creating a Block Graph
Concept of block graph was explained through a practical application wherein teacher made a chart of favourite fruits and children placed bl...
-
Auditions were held for an interschool competition "Fruity shapes" where in different interesting shapes had to be made through 2...
-
Each child was given a number card from 1 to 10. Teacher announced any number let's say 5 and the child who had a corresponding number c...
-
Understanding big and small lays the foundation for early mathematical concepts such as measurement, comparison, and estimation. These are...